
This guide describes how you can get started with Charmed Kubeflow (CKF), from deploying to accessing it. It is intended for system administrators and end users.
CKF provides a simple, out-of-the-box way to deploy Kubeflow. It sets default configurations, while still providing flexibility to configure it as you like.
This tutorial deploys the latest supported version of CKF. For using other versions, check Supported versions for compatibility with Kubernetes and Juju.
Requirements
- Ubuntu 22.04 or later.
- A host machine with at least a 4-core CPU processor, 32GB RAM and 50GB of disk space available.
Install and configure dependencies
CKF relies on:
- Kubernetes (K8s). This tutorial uses MicroK8s, an open-source zero-ops lightweight distribution of Kubernetes, to run a K8s cluster.
- A software orchestration engine. This tutorial uses Juju to deploy and manage the Kubeflow components.
Install MicroK8s
This tutorial deploys the latest version of K8s supported in CKF. For using other versions, check Supported versions for compatibility with Juju. If you have already installed MicroK8s, you may skip some steps within this section.
MicroK8s can be installed using snap as follows:
sudo snap install microk8s --channel=1.32/stable --classic
After MicroK8s is installed, you need sufficient permissions to access it. Grant those as follows:
sudo usermod -a -G microk8s $USER
To refresh the permissions, restart your machine or run the following command:
newgrp microk8s
See Get started with MicroK8s for more details about installing MicroK8s.
Configure MicroK8s
For deploying CKF, additional features from the default ones that come with MicroK8s are needed. These can be installed as MicroK8s add-ons. Run the following command to enable them:
sudo microk8s enable dns hostpath-storage metallb:10.64.140.43-10.64.140.49 rbac
To confirm that all add-ons are successfully enabled, check the MicroK8s status as follows:
microk8s status
The add-ons configuration may take a few minutes to complete before they are listed as enabled.
Install Juju
This tutorial uses Juju 3.6. For using other versions, check Supported versions for compatibility with K8s. If you have already installed Juju, you may skip some steps within this section.
Juju can be installed using snap as follows:
sudo snap install juju --channel=3.6/stable
On some machines, there might be a missing folder required for Juju. To ensure this folder exists, create it as follows:
mkdir -p ~/.local/share
See Get started with Juju for more details about installing Juju.
Configure Juju
Enable MicroK8s for Juju as follows:
microk8s config | juju add-k8s my-k8s --client
Next, deploy a Juju controller to your MicroK8s cluster:
juju bootstrap my-k8s uk8sx
The controller may take a few minutes to deploy.
The Juju controller is used to deploy and control the Kubeflow components.
You now need to create a Kubeflow model for the Juju controller as follows:
juju add-model kubeflow
The model name must be kubeflow.
Deploy CKF
MicroK8s uses inotify to interact with the file system. Kubeflow requires increasing the inotify limits. To do so, run the following commands:
sudo sysctl fs.inotify.max_user_instances=1280
sudo sysctl fs.inotify.max_user_watches=655360
If you want these commands to persist across machine restarts, add the following lines to /etc/sysctl.conf:
fs.inotify.max_user_instances=1280
fs.inotify.max_user_watches=655360
To deploy CKF with Juju, run the following command:
juju deploy kubeflow --trust --channel=1.10/stable
The deployment may take a few minutes to complete.
Once the deployment is completed, you get a message like the following:
Deploy of bundle completed.
After the deployment, the bundle components need some time to initialise and establish communication with each other. This process may take up to 20 minutes.
Check the status of the components as follows:
juju status
Use the watch option to continuously track their status:
juju status --watch 5s
You should expect an output like this:
Model 	Controller  Cloud/Region  	Version  SLA      	Timestamp
kubeflow  uk8sx   	my-k8s/localhost  3.6.4	unsupported  16:12:02Z

App                  	Version              	Status  Scale  Charm                	Channel      	Rev  Address     	Exposed  Message
admission-webhook                             	active  	1  admission-webhook    	1.10/stable   	411  10.152.183.153  no
argo-controller                               	active  	1  argo-controller      	3.4/stable   	683  10.152.183.168  no
dex-auth                                      	active  	1  dex-auth             	2.41/stable  	641  10.152.183.184  no
envoy                                         	active  	1  envoy                	2.4/stable   	364  10.152.183.74   no

Unit                    	Workload  Agent  	Address 	Ports      	Message
admission-webhook/0*    	active	idle   	10.1.80.9
argo-controller/0*      	active	idle   	10.1.80.10
dex-auth/0*             	active	idle   	10.1.80.11
envoy/0*                	active	idle   	10.1.80.14
CKF is ready when all the applications and units are in active status. During the configuration process, some of the components may momentarily change to a blocked or error state. This is an expected behaviour that should resolve as the bundle configures itself.
Access your deployment
You can interact with CKF using a dashboard, accessed through an IP address.
Configure dashboard access
To enable authentication for the dashboard, set a username and password as follows:
juju config dex-auth static-username=admin
juju config dex-auth static-password=admin
Access the dashboard
To check the IP address associated with your deployment, run the following command:
microk8s kubectl -n kubeflow get svc istio-ingressgateway-workload -o jsonpath='{.status.loadBalancer.ingress[0].ip}'
You should see an output like this: 10.64.140.43, which is the default IP address used in the MicroK8s configuration. If the output shows a different IP, use that IP for the rest of this tutorial.
To access your deployment, open a browser and visit the dashboard IP. You should see the login page where you need to enter the credentials previously set up.
Enter the username in the “Email Address” field.
You should now see the welcome page:

Get started by clicking on Start Setup. Next, create a namespace for keeping all files and settings within a single location:

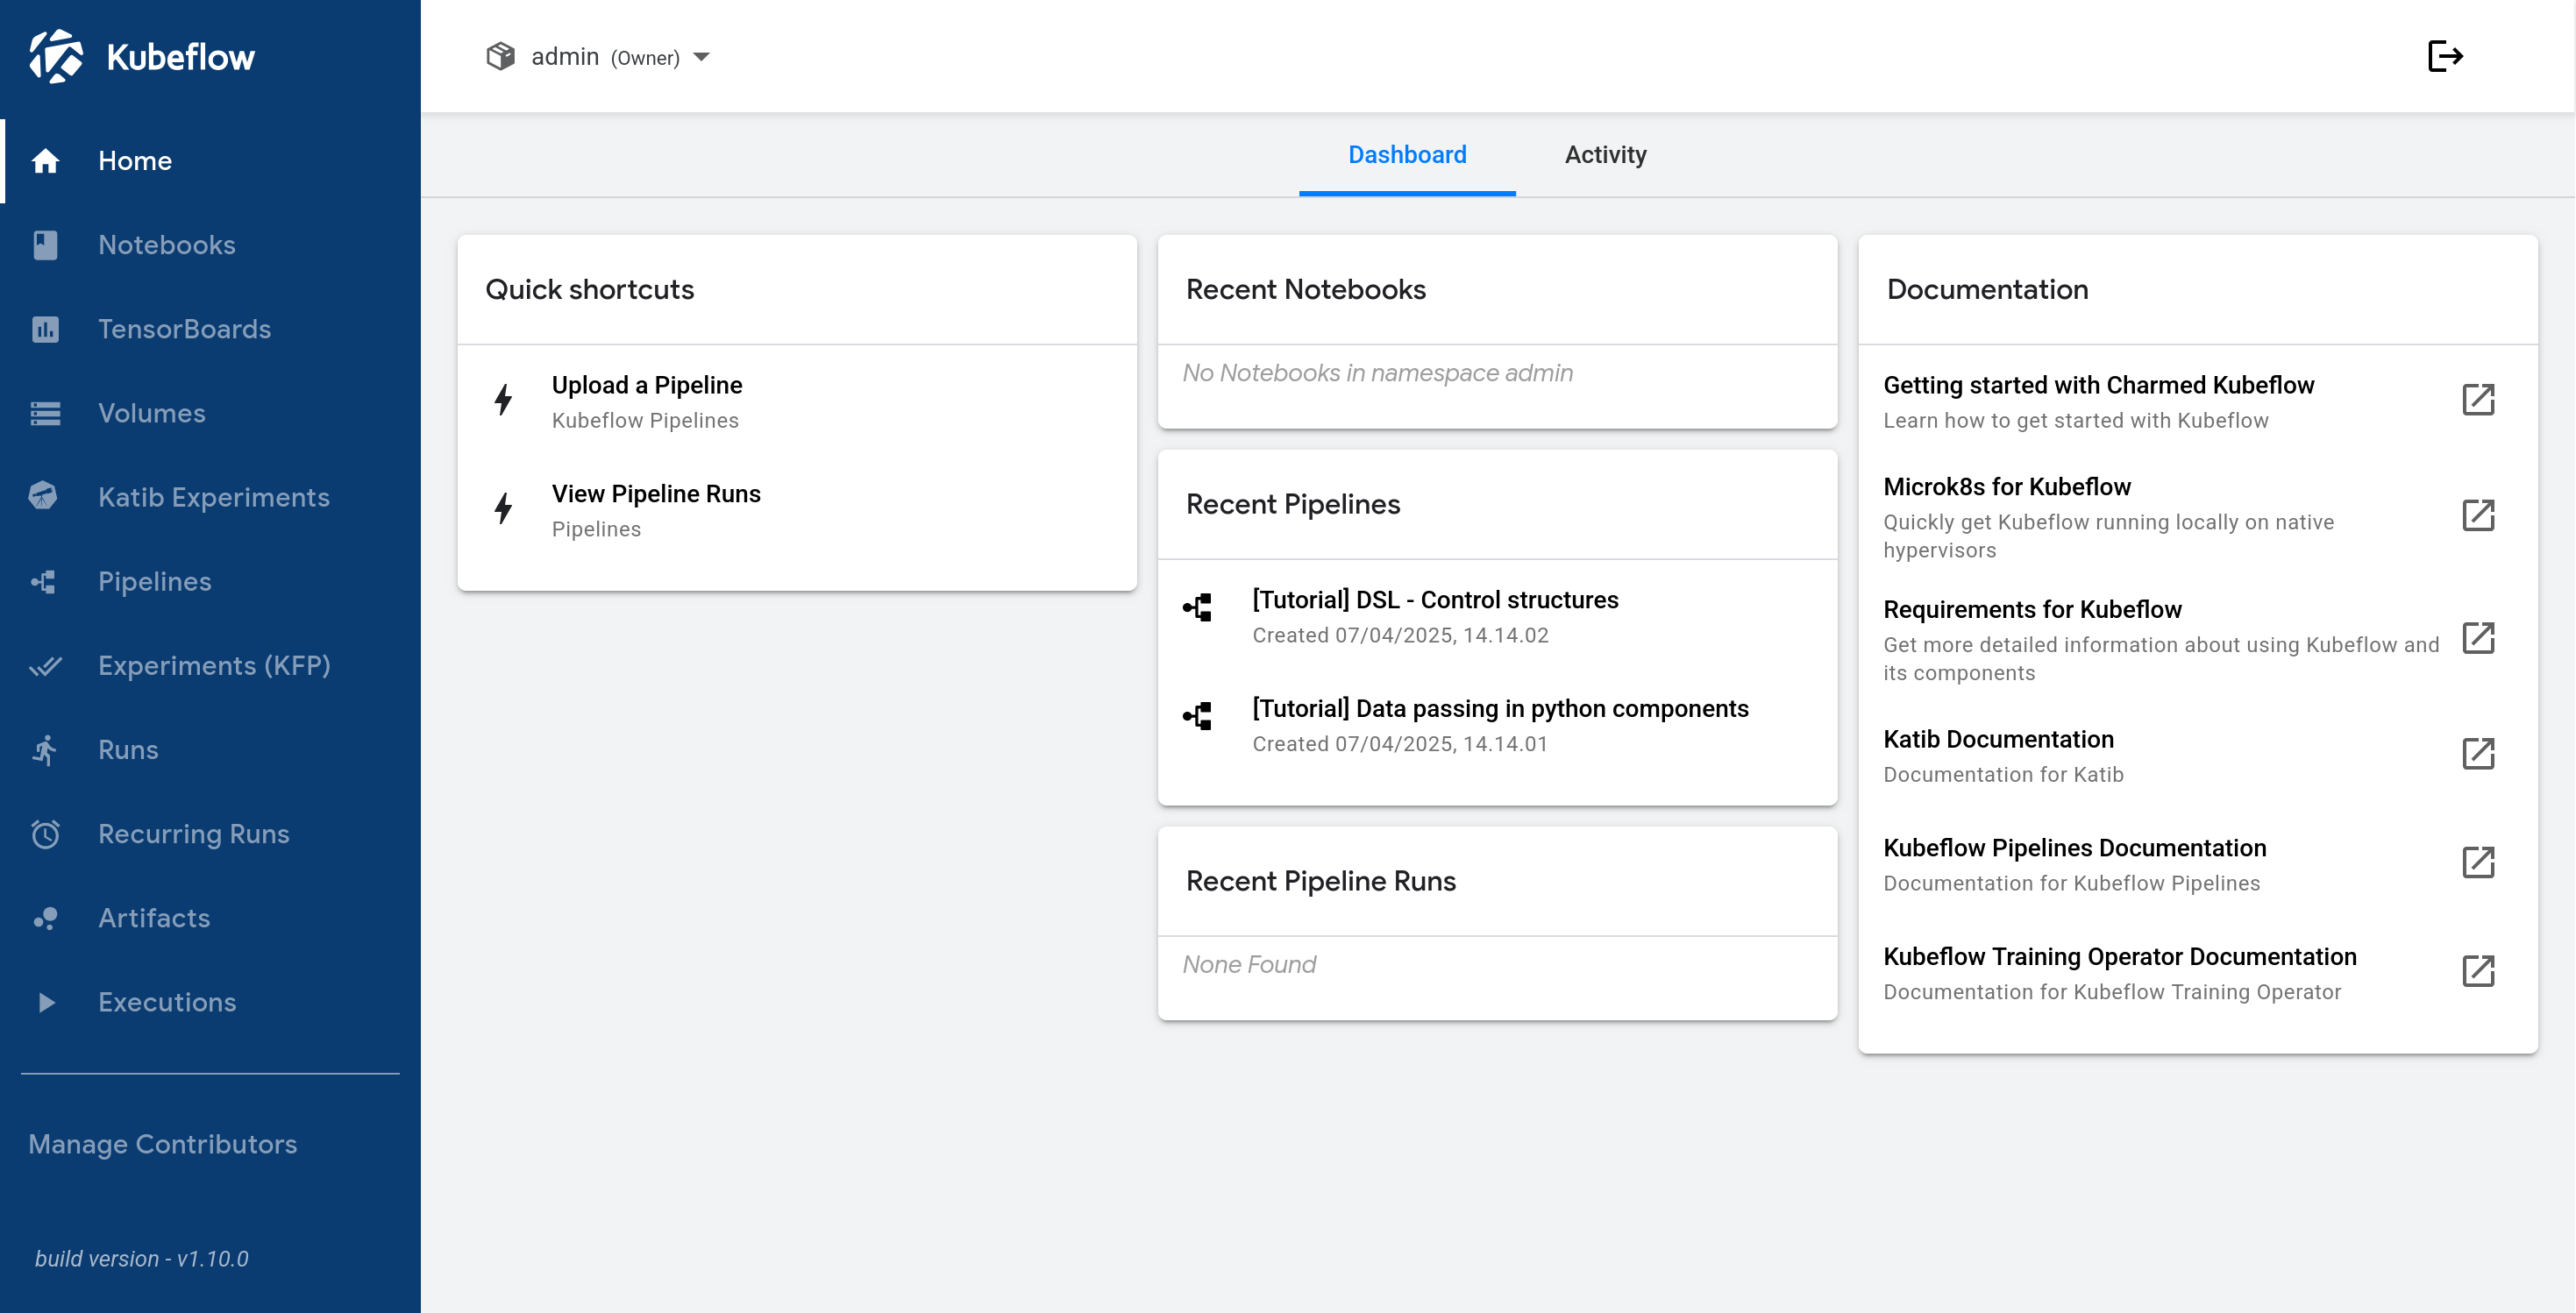
Click on Finish to display the dashboard:
Next steps
- Once deployed, build your first ML model on Kubeflow.
- To learn about common tasks and use cases, see how-to guides.
- To learn about the advantages of using CKF over upstream Kubeflow, see Upstream vs Charmed Kubeflow.
Last updated 3 months ago.