
This guide presents the Grafana dashboards provided by Charmed Kubeflow (CKF). See Grafana dashboards for more details.
All Grafana dashboards provided by CKF use the ckf tag.
Generic dashboards
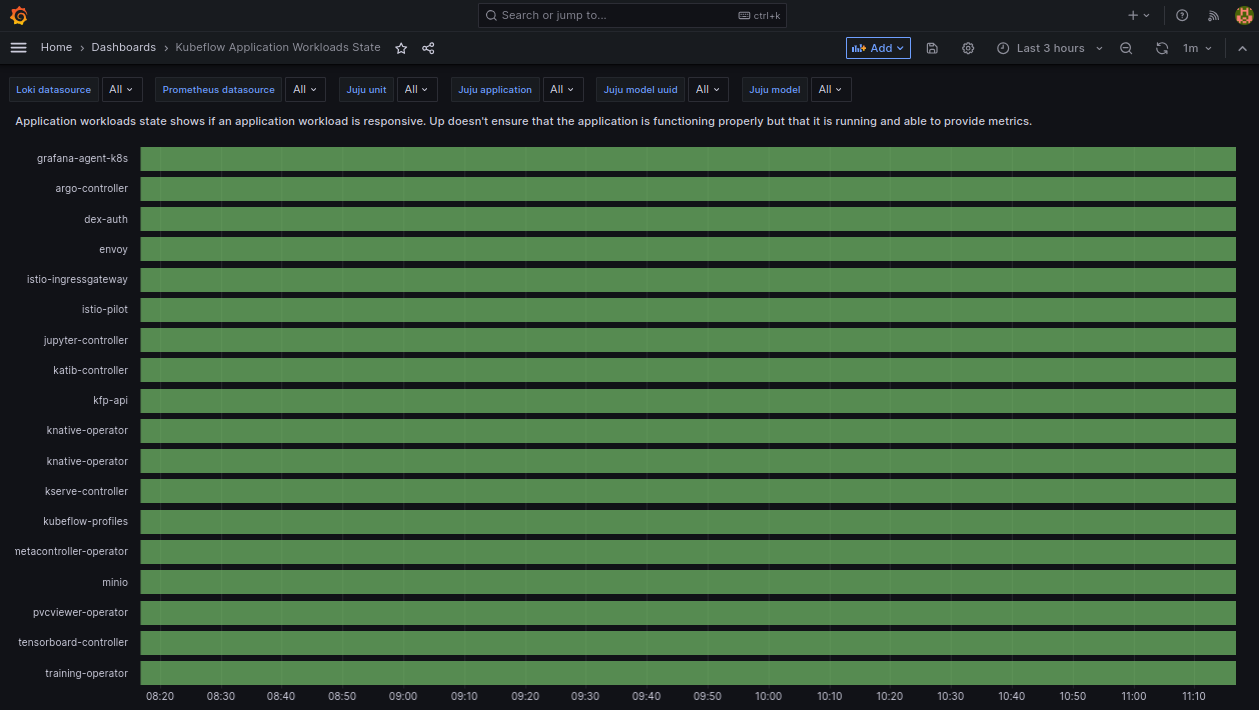
CKF charms state
This dashboard shows the state, up represented in green or down represented in red, of CKF charms. This includes only charms that provide metrics. See Prometheus metrics to learn which are those.
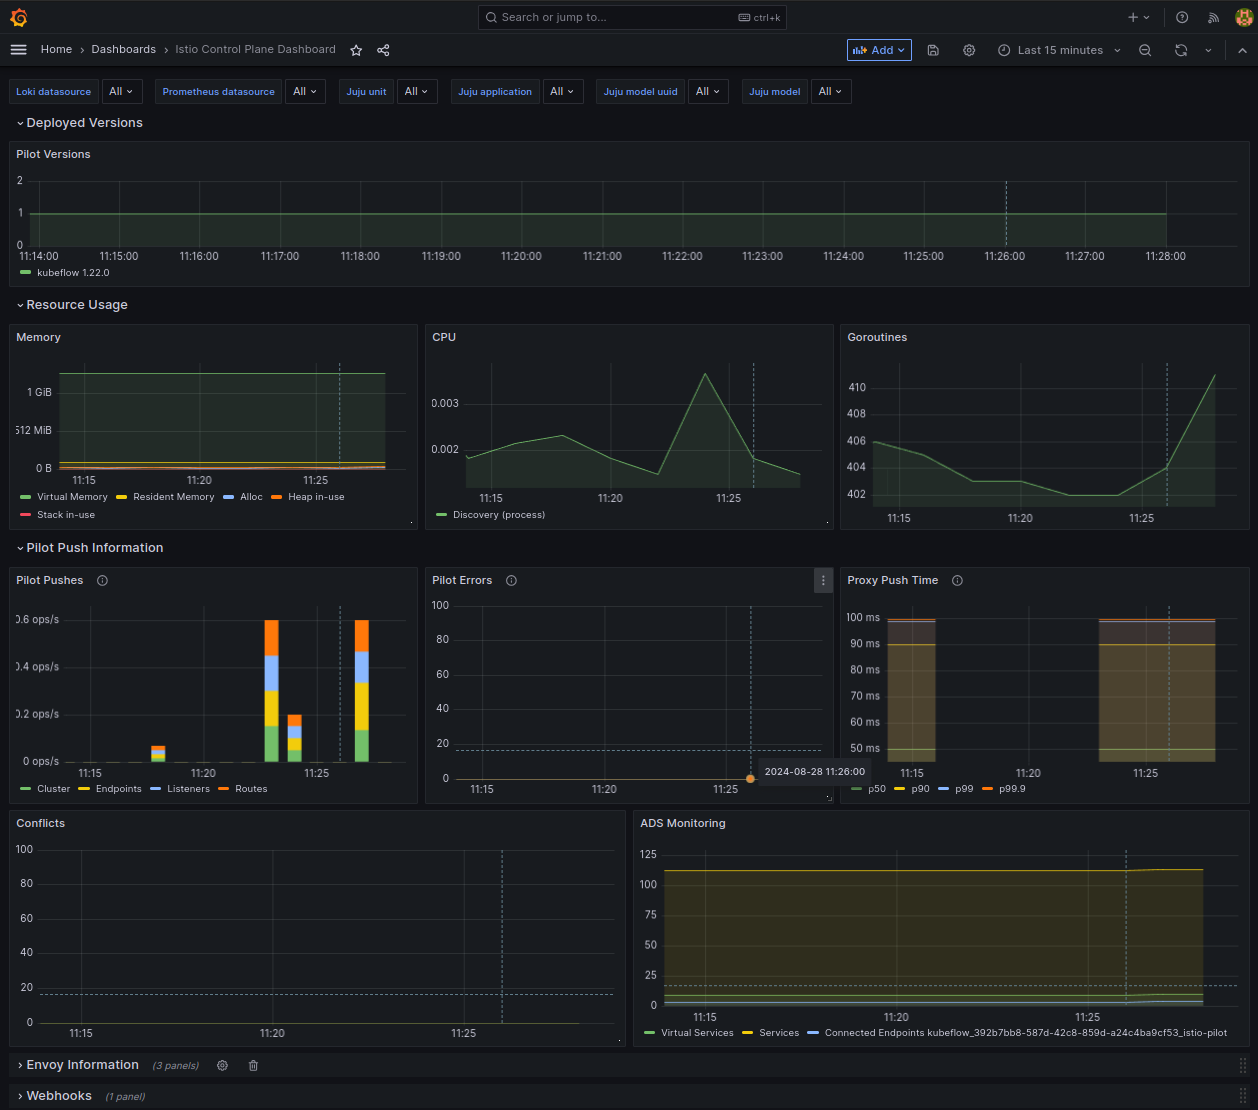
Istio control plane
This dashboard provides a general overview of the health and performance of the Istio control plane. It combines metrics from istio-pilot and istio-gateway.
See Visualizing Istio metrics with Grafana for more details.
Pipelines
The following dashboards provide visualisations related to Kubeflow Pipelines (KFP).
ArgoWorkflow metrics
The metrics from the Argo Workflow controller expose the status of Argo Workflow custom resources, including the following information:
- The number of workflows that have failed or are in
errorstate. - The time workflows spend in the queue before being run.
- The total size of captured logs that are pushed into S3 from the workflow pods.


Envoy service
The metrics from the envoy proxy expose the history of requests proxied from the KFP user interface to the MLMD application, including the following information:
- The total number of requests.
- The success rate of requests with status code
non 5xxas well the number of requests with4xx response, either upstream or downstream.


MinIO dashboard
The metrics from MinIO expose the status of the S3 storage instance used by KFP, including the following information:
- S3 available space and storage capacity.
- S3 traffic.
- S3 API request errors and data transferred.
- Node CPU, memory, file descriptors and IO usage.


Notebooks
The following dashboards provide visualisations related to Kubeflow Notebooks.
Jupyter Notebook controller
The metrics from the Jupyter controller expose the status of Jupyter Notebook custom resources.

Experiments
The following dashboards provide visualisations related to Katib experiments.
Katib status
The metrics from the Katib controller expose the status of Experiment and Trial custom resources.

Serving models
The following dashboards provide visualisations related to serving ML models.
Seldon Core
The metrics from the Seldon Core controller expose the status of Seldon Deployment custom resources, also called models, including information related to Seldon deployments currently available on the controller.

Last updated 9 months ago.