
This tutorial walks you through some of the main components of Kubeflow. Think of each section as its own mini-tutorial. You can do whichever ones you like. The order in which you do these sections doesn’t really matter, but there are some references to previous sections, so it’s advisable to just start from the top and work your way down!
Requirements:
We assume you have Kubeflow deployed and can log in to Kubeflow via the Kubeflow Dashboard. See Getting Started with Charmed Kubeflow to learn more about Kubeflow and how to deploy Charmed Kubeflow.
Contents:
Kubeflow Notebooks
In this section, we will:
- Create a Kubeflow Notebook server, upload a notebook and run it
- Stop the Kubeflow notebook server
- Delete the Kubeflow notebook server and associated data
Let’s begin!
Create a Kubeflow Notebook
Click on Notebooks in the left-side navigation of the Dashboard and then click on the New notebook button.
You will see a screen displaying configuration options for the new notebook. Choose the following options:
- For
Nameenterfirst-notebook. - Expand the Custom Notebook section and for
imageselectkubeflownotebookswg/jupyter-tensorflow-full:v1.7.0.
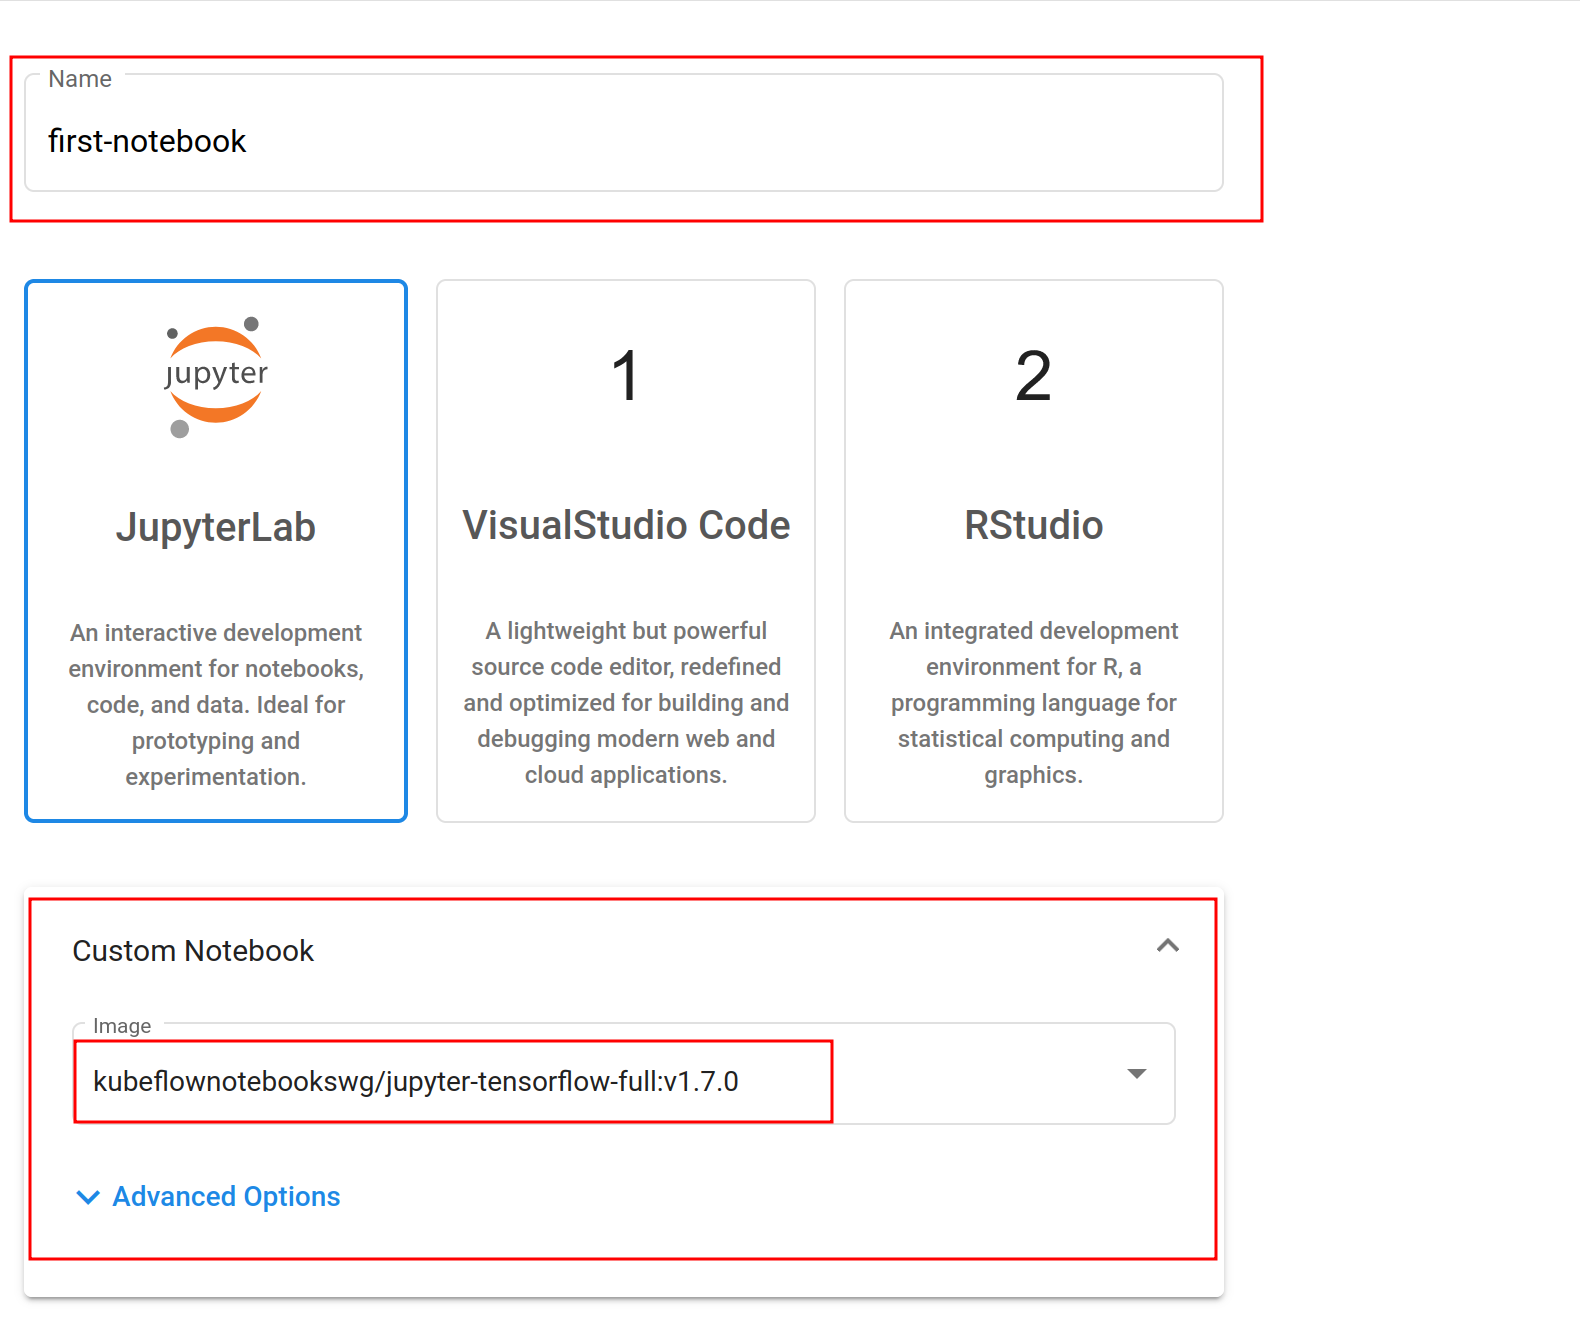
Leave all other settings as they are. Scroll the page to the bottom and click Launch.
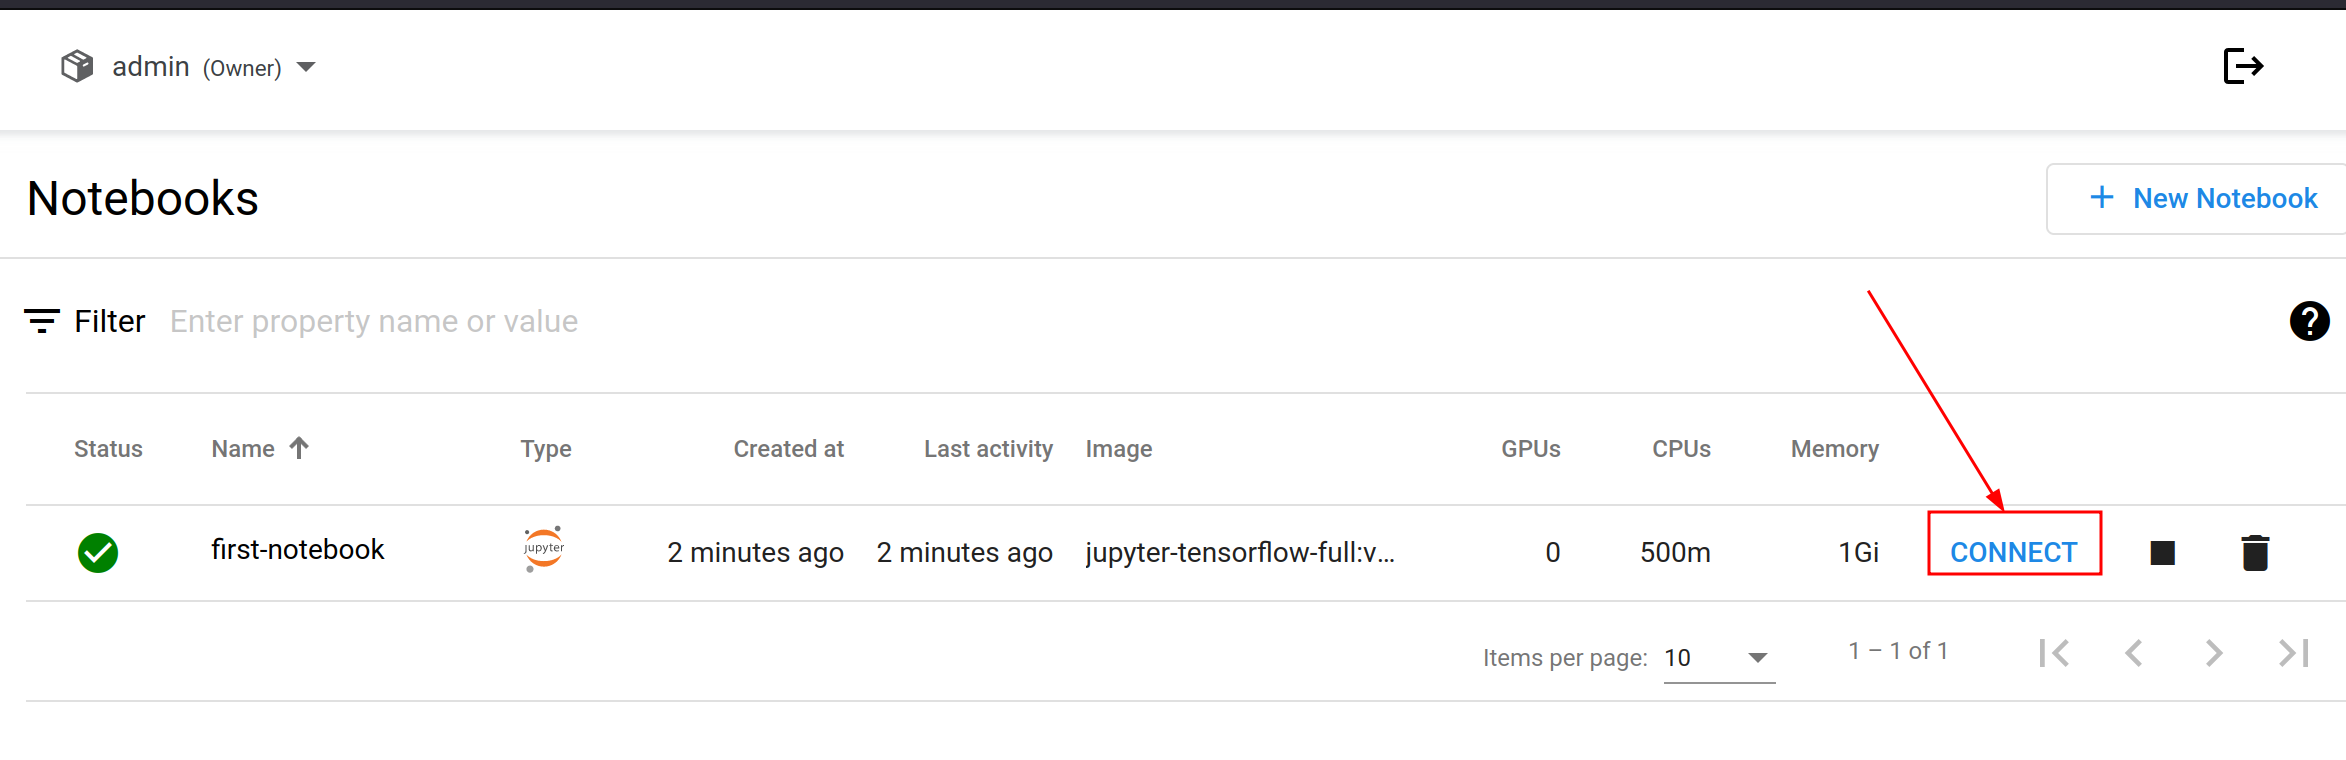
This will spin up a new notebook server. You should see your notebook server listed in the Notebooks table.
Be patient, the notebook server might take a minute or two to initialise. When the notebook is ready, the status column will indicate success. Click Connect to open your Jupyter Notebook environment in a new tab.
At this point, we could create our own notebook from scratch. But let’s use an existing notebook to make life easier!
Download the file advanced.ipynb from Tensorflow 2 quickstart for experts example.
From the Jupyter Notebook environment tab, click the Upload button and select the advanced.ipnyb file that we just downloaded.
Having trouble locating the button? The upload button is located at the top of the sidebar and appears as an arrow pointing upwards.
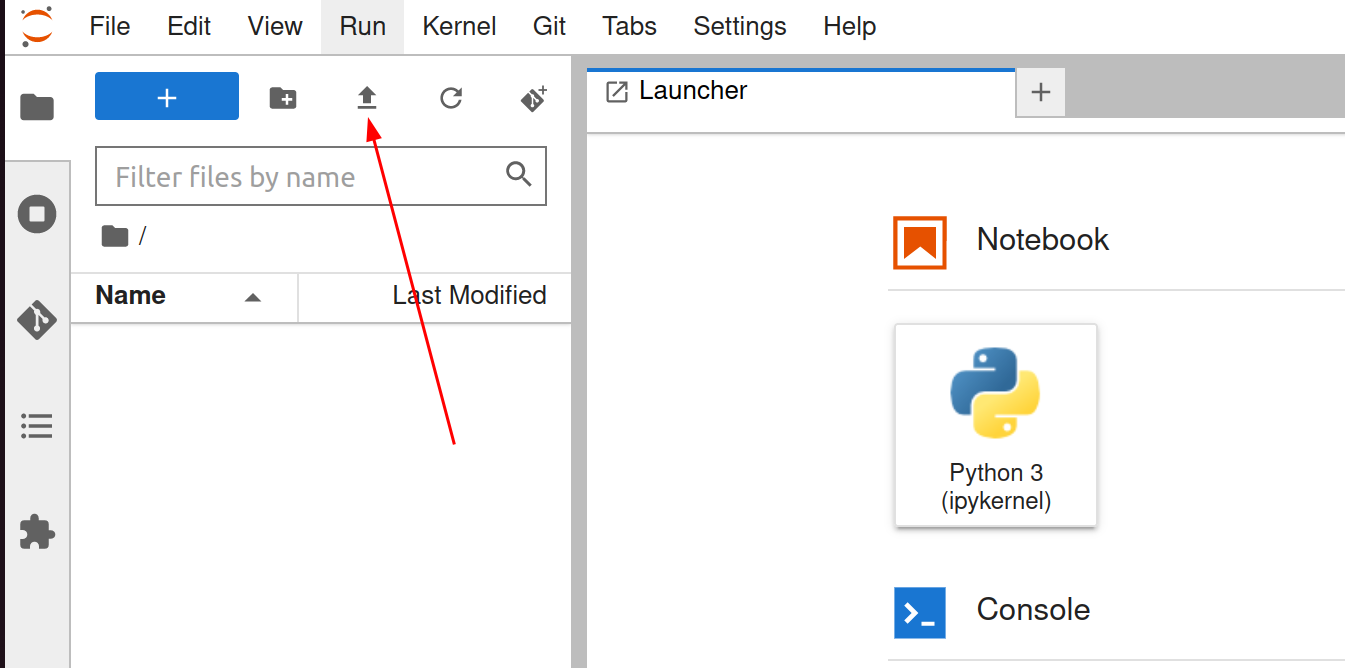
Once uploaded, double click on the notebook name to open a new tab with the notebook content.

Read through the content for a better understanding of what this notebook does. Click on the Run button to execute each stage of the document, or click on the double-chevron (>>) to execute the entire document.
Stop a Kubeflow Notebook Server
Now let’s stop our notebook server:
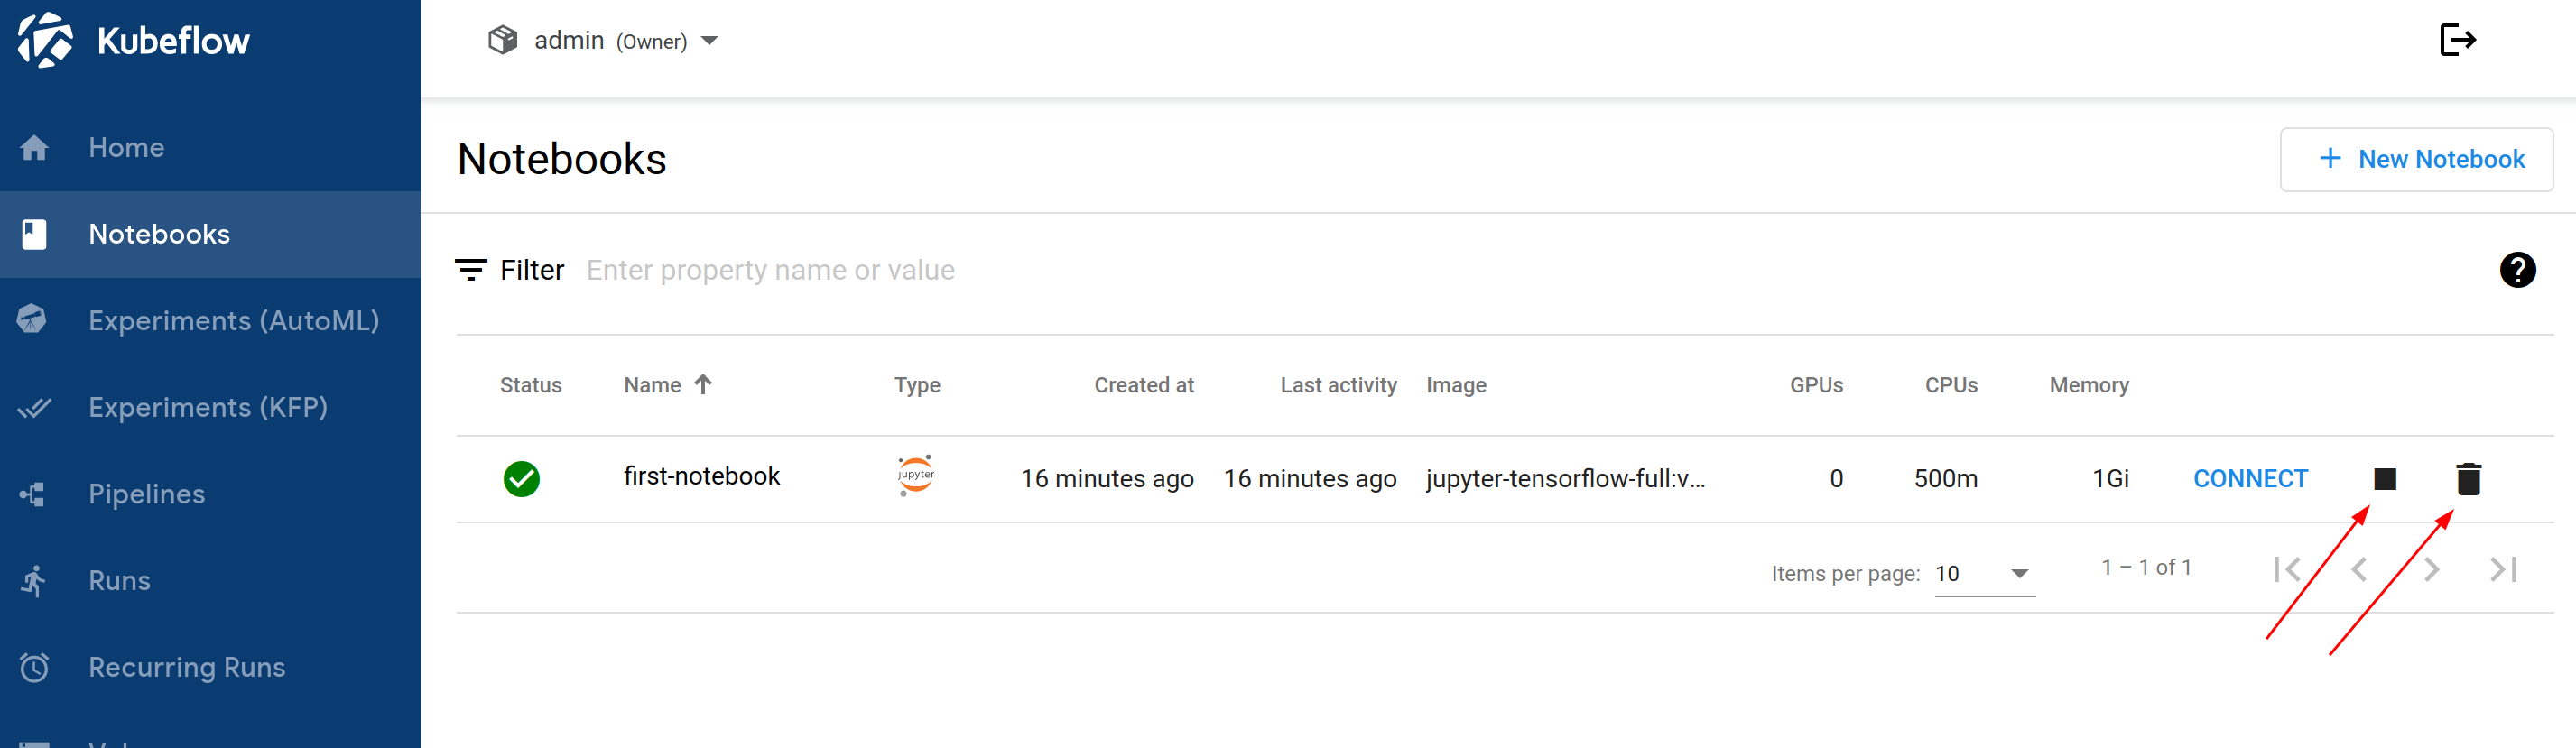
- Click on
Notebooksin the left-side navigation. - Click on stop (rectangle icon)
- Confirm the operation
When the operation completes, the notebook server status will change to indicate that it’s stopped.
Stuck status? If the status doesn’t seem like it’s updating, try refresh your browser.
Delete a Kubeflow Notebook Server
OK, we’ve stopped the notebook server, and it’s no longer running. But it’s still there. Let’s now fully remove our notebook server. To do so, stay on the Notebooks tab and follow these steps:
- Click on the delete (trash icon) button
- Confirm the operation
We’re not done yet! All the notebooks created by default will have an associated volume which will not be deleted when the notebook is removed. We need to find and remove this volume.
Let’s do it:
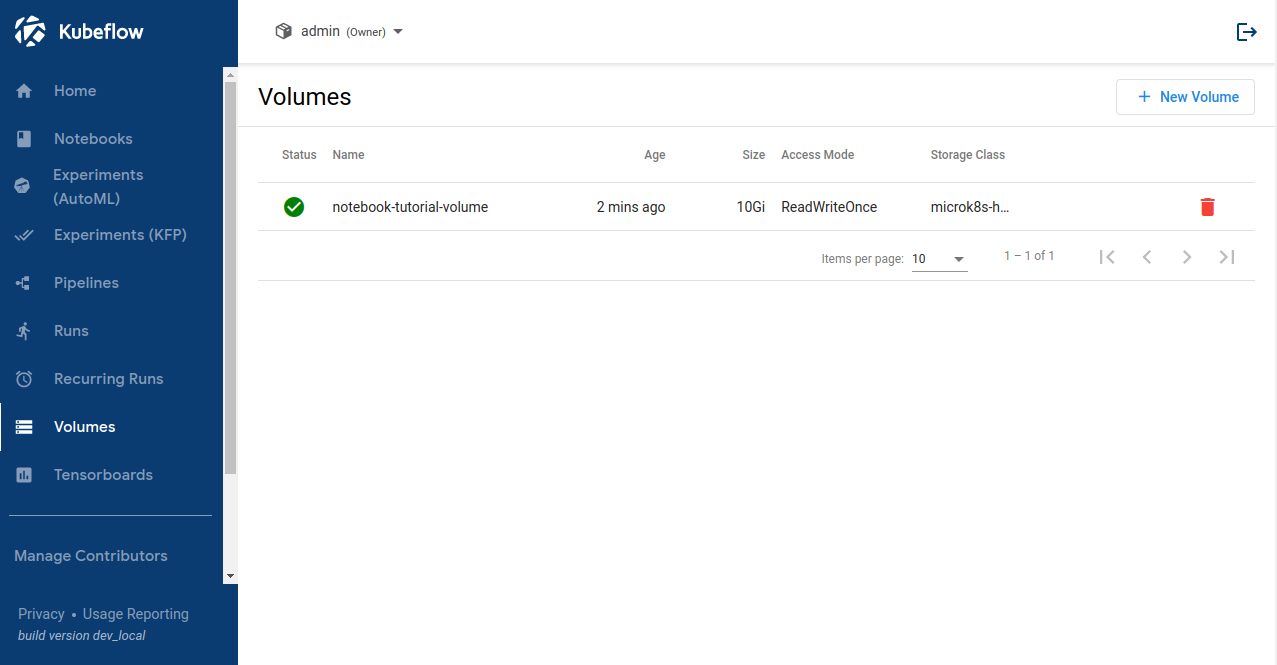
- Click on Volumes on the left side-bar.
- Click on trash icon right to the name of the volume (volume has the same name as the notebook with ”-volume” at the end)
- Confirm operation
Want more info? See Kubeflow Notebooks Overview in the upstream documentation.
Kubeflow Pipeline
Now let’s explore another cool Kubeflow feature: pipelines. In this section, we will:
- Install the pipeline compiler tools
- Get a pipeline example from GitHub
- Compile the pipeline
Then, within Kubeflow we will:
- Upload the compiled pipeline
- Execute the pipeline
- Delete the pipeline
Install pipeline compiler
Let’s install the pipeline compiler. The compiler is part of a Python package called Kubeflow Pipeline or kfp and can be installed with pip. First, install pip if you don’t already have it:
sudo apt update
sudo apt install python3-pip
Next, use pip to install the Kubeflow Pipeline package:
python3 -m pip install kfp==1.8.0
Be patient: kfp may take a minute or so to install.
Get a pipeline example
Let’s use a Sample Pipeline from GitHub for this. Download this file:
wget https://raw.githubusercontent.com/canonical/kfp-operators/main/tests/integration/pipelines/sample_pipeline_execution_order.py
Compile pipeline
Let’s now compile the pipeline with kfp, so that we can run it in Kubeflow later.
From the directory where you saved the Python file, run this command to compile the pipeline:
python3 sample_pipeline_execution_order.py
This will compile the pipeline from Python code into YAML that Kubeflow will be able to understand. The output file will be called sample_pipeline_execution_order.py.yaml.
Soon, we’re going to need to upload this file from our local computer to Kubeflow through our browser. Assuming you are SSHing into a VM for this tutorial, then copy the sample_pipeline_execution_order.py.yaml file to your local computer by running the scp command from a terminal on your local computer:
scp -i ~/.ssh/myKey.pem ubuntu@myserver.cloudomain.com:\~/sample_pipeline_execution_order.py.yaml ~/Downloads/sample_pipeline_execution_order.py.yaml
If you’re running everything locally, then don’t worry, there’s no need to do the scp step as the file is already on your local machine.
Great, we’ve now compiled our pipeline to sample_pipeline_execution_order.py.yaml and we have that file on our local machine, ready to upload to Kubeflow.
Add the compiled pipeline
Finally, we’re ready to get back to the Kubeflow Dashboard and upload our pipeline. Select the Pipelines section from the sidebar and then select Upload Pipeline.
In the upload section choose the “Upload a file” section and choose the sample_pipeline_execution_order.py.yaml file that we created in the previous step. Name the pipeline sample-pipeline-execution-order. Then click “Create” to create the pipeline.
Once the pipeline is created you will be redirected to its Dashboard.
Execute the pipeline
To execute our pipeline, let’s create an “Experiment”. Click the Create Experiment button and name the experiment new-experiment.

Don’t worry too much about what an experiment is for now- just think of it as a place where we can run our pipeline.
Once the experiment is added, you will be redirected to Start a Run. This pipeline needs two “Run parameters”. It will just print these out. Fill in the run parameters e.g. “Hello” and “World”.
Leave all the other options as they are. Then click Start to create your first Pipeline run!
Look at results
Once the run is started, the browser will redirect to Runs. In our case, there’ll just be one run listed. After a few minutes there should be a checkmark in the status column showing that it has been executed successfully.
To see the result of our run, click on its name. A new window will open that will show all the steps of the pipeline that were executed. If you click on each step, a details pane will open where you can review that step. Explore this for yourself. In particular, can you notice where “Hello” and “World” were printed out?
Solution: access variable printouts
To see where “Hello” and “World” were printed out, go to the “Logs” tab.
Delete pipeline
Right, let’s delete the pipeline. You can do this from the Pipelines tab on the Kubeflow Dashboard. See if you can figure out how!
Stuck? More info on how to delete your pipeline
To delete the pipeline, select it, using the thick box placed on the left side of the name. Then, go to the top right corner, and click “Delete”
A new window will appear, that asks you to confirm the pipeline deletion. Click again on “Delete”.
That’s it, your pipeline is now deleted!
Want to learn more? The official Kubeflow Documentation explains the recommended workflow for creating a pipeline. This documentation is well worth reading thoroughly to understand how pipelines are constructed.
Katib
Let’s explore another cool feature of Kubeflow: Katib. Katib automates the tuning of machine learning hyperparameters - those which control the way and rate at which the AI learns; as well as offering neural architecture search features to help you find the optimal architecture for your model. In this section, we’re going to explore two ways you can use Katib to do hyperparameter tuning:
- Hyperparameter tuning on the command line
- Hyperparameter tuning though the Kubeflow UI
Let’s begin!
More information is available on the upstream documentation on Katib
First off, let’s introduce you to the concept of an experiment. An experiment in Katib is a single tuning operation and consists of an objective (what is to be optimised), a search space(the constraints used for the optimisation) and an algorithm(how to find the optimal values). See more in the upstream documentation on experiment.
Right, so let’s run our first experiment! To begin with, we’ll run an experiment on the command line. The experiment specification will be defined in a .yaml file, and we will use the Kubernetes CLI command kubectl to launch this experiment.
Rather than write our own experiment from scratch, let’s just grab an existing one and run that. Execute the following curl command to download an experiment from GitHub to your local machine:
curl https://raw.githubusercontent.com/kubeflow/katib/master/examples/v1beta1/hp-tuning/grid.yaml > grid-example.yaml
Next, execute this command, which is slightly technical:
yq -i '.spec.trialTemplate.trialSpec.spec.template.metadata.annotations."sidecar.istio.io/inject" = "false"' grid-example.yaml
If you don’t have
yqinstalled, install it withsudo snap install yq.
For now, don’t worry too much about what this does. Basically, the yq command adds an instruction to the YAML to disable istio sidecar injection when running the experiment, due to the incompatibility of this feature with Katib experiments. This is documented in more details in the Katib upstream docs- just search for “istio”.
One more thing before we run the experiment! Remember the username you used to login to Kubeflow earlier? E.g. admin? Well, Kubeflow should have created a corresponding Kubernetes namespace for this user, and you want to run your experiment in that namespace. To ensure that happens, let’s use yq again to modify our YAML file. Run this command:
yq -i '.metadata.namespace = "admin"' grid-example.yaml
This sets the namespace for the experiment to admin.
Great! Now we’re ready to create the experiment in Kubeflow using kubectl. To do so, run this command:
microk8s kubectl apply -f grid-example.yaml
We can inspect experiment progress using kubectl by running the following command:
microk8s kubectl -n <your namespace> get experiment grid -o yaml
The output should specify that the experiment was created. To see your experiment in the Kubeflow UI go to the Experiments (AutoML) tab.
Great - we now know how to create experiments from the command line. This is super useful when we want to create experiments through automated scripting. But what if we just want to create the experiment through the UI, without touching the command line? We’re in luck! There’s a way to do that too.
Let’s now use the UI to upload and run the same experiment that we just created on the command line. Open grid.yaml in a browser tab or on your local machine. Then, in Kubeflow, go to Experiments (AutoML), and select “New Experiment”.

Click the link at the bottom of the page labelled “Edit and submit YAML”, and paste the contents of the yaml file in there. Change the YAML contents manually as follows:
- Change the namespace to
admin(assuming you created the Kubeflow user called “admin”) - Add
sidecar.istio.io/inject="false"under.spec.trialTemplate.trialSpec.spec.template.metadata.annotations. - Change the name from
gridtogrid-ui. Remember - we already have an experiment calledgridwhich we created on the command line; each experiment must have a unique name.
Note: Remember we used the
yqcommand in the previous section to add"sidecar.istio.io/inject" = "false"'? Well, here we’re doing the same thing, but manually.
Stuck? Expand to see example YAML with modifications
---
apiVersion: kubeflow.org/v1beta1
kind: Experiment
metadata:
  namespace: admin
  name: grid-ui
spec:
  objective:
    type: maximize
    goal: 0.99
    objectiveMetricName: Validation-accuracy
    additionalMetricNames:
      - Train-accuracy
  algorithm:
    algorithmName: grid
  parallelTrialCount: 3
  maxTrialCount: 12
  maxFailedTrialCount: 3
  parameters:
    - name: lr
      parameterType: double
      feasibleSpace:
        min: "0.001"
        max: "0.01"
        step: "0.001"
    - name: num-layers
      parameterType: int
      feasibleSpace:
        min: "2"
        max: "5"
    - name: optimizer
      parameterType: categorical
      feasibleSpace:
        list:
          - sgd
          - adam
          - ftrl
  trialTemplate:
    primaryContainerName: training-container
    trialParameters:
      - name: learningRate
        description: Learning rate for the training model
        reference: lr
      - name: numberLayers
        description: Number of training model layers
        reference: num-layers
      - name: optimizer
        description: Training model optimizer (sdg, adam or ftrl)
        reference: optimizer
    trialSpec:
      apiVersion: batch/v1
      kind: Job
      spec:
        template:
          metadata:
            annotations:
              sidecar.istio.io/inject: "false"
          spec:
            containers:
              - name: training-container
                image: docker.io/kubeflowkatib/mxnet-mnist:latest
                command:
                  - "python3"
                  - "/opt/mxnet-mnist/mnist.py"
                  - "--batch-size=64"
                  - "--lr=${trialParameters.learningRate}"
                  - "--num-layers=${trialParameters.numberLayers}"
                  - "--optimizer=${trialParameters.optimizer}"
            restartPolicy: Never
Click "Create to submit the experiment.

Once the experiment has been created, go to the Katib Dashboard and select the experiment.

Open the Experiment Details tab to see how your experiment is progressing. The experiment will take a while to run. In the meantime, feel free to leave it running and go do something else.
When the experiment completes, you will be able to see the recommended hyperparameters on the Experiment details tab.

Great, that’s it! We’ve now run a Katib experiment in two different ways: once through the command line, and then through the UI.
Tensorboard
Tensorboard provides a way to visualise your ML experiments. With Tensorboard you can track metrics such as loss and accuracy, view histograms of biases, model graphs and much more. You can learn more about the project on the upstream website.
Let’s try out Tensorboard for ourselves! We’ll reuse the notebook server created in previous step. Connect to it and upload a new notebook for Tensorboard Download the notebook here.
Note the log_dir path specified in the Notebook - we’ll need this later to create a Tensorboad in Kubeflow.

Run the notebook in the notebook server. Then in the main Kubeflow UI, navigate to Tensorboards.
Click on New Tensorboard. Name it and select the PVC checkbox. Select your notebook’s workspace volume from the dropdown list and fill in the Mount Path field with the log_dir you have noted in the previous step. In our example it’s logs/fit.

That’s it! Click on Create and sit tight while your Tensorboard gets ready. The Tensorboard should be ready within a couple of minutes.

Once the Tensorboard is ready, connect to it to see various metrics and graphs.

Get in Touch
Did you find this tutorial helpful? Painful? Both? We’d love to hear from you. Get in touch with us on Matrix.
Last updated 5 months ago.